
Kibana is a powerful and flexible monitoring dashboard and tool for monitoring firewall activity. I find it essential to monitor these activities graphically as these logs are generally quite noisy and it’s sometimes difficult to identify real issues.
In this guide we will focus on the Logstash and Juniper parts. There are several guides out there that walks you thought in how to setup the ELK stack. For my homelab environment I have decided to run the following VMs for ELK:
- 2x Logstash “ingest” nodes
- 2x Elasticsearch cluster nodes
- 1x Kibana Dashboard node
- 1x Kemp load balancer towards the Logstash nodes
- 1x vSRX firewall running in VMware ESXi
The load balancer is mostly used as a VIP destination for the Juniper SRX Syslog as you don’t really have that great of redundancy within SRX, and it makes maintenance easier. I’m using the free version of Kemp in this example and only L3.
Now let’s get into configuration mode 😀
Configuring the Juniper SRX firewall.
Althought the below config was done on a Juniper vSRX it’s essentially the same across all Juniper SRX series, I’ve used the same config on a SRX 5800 without issues. Bear in mind that you might have to source-address your requests for the FW to route them correctly. The interesting routing decisions on the SRX might be an article for another time 🙂
set system syslog host lsn-vip.nebuchadnezzar.local any any
set system syslog host lsn-vip.nebuchadnezzar.local match RT_FLOW_SESSION
set system syslog host lsn-vip.nebuchadnezzar.local port 5000
set system syslog host lsn-vip.nebuchadnezzar.local source-address 10.0.10.10
In the above config I’m using a FQN for my Kemp load-balancer.
Log-stash
Logstash is really friendly to parse logs using their grok parser. This is just a basic config, there are quite a lot more one can do in terms of “cleaning up” things. If needed one can also do DNS lookups for PTR records to make it more user friendly, I decided not do to that as this is just a home-lab setup.
input {
 syslog {
 port => 5000
 type => "syslog"
 }
}

filter {

if [type] == "syslog" {

if [message] =~ "RT_FLOW_SESSION_CREATE" {
 mutate {
 add_tag => "FLOWCREATE"
 }
}
if [message] =~ "RT_FLOW_SESSION_DENY" {
 mutate {
 add_tag => "FLOWDENY"
 }
}

if "FLOWCREATE" in [tags] {
 grok {
 match => [ "message", ".*session created %{IP:src_addr}/%{DATA:src_port}->%{IP:dst_addr}/%{DATA:dst_port} %{DATA:service} %{IP:nat_src_ip}/%{DATA:nat_src_port}->%{IP:nat_dst_ip}/%{DATA:nat_dst_port} %{DATA:src_nat_rule_name} %{DATA:dst_nat_rule_name} %{INT:protocol_id} %{DATA:policy_name} %{DATA:from_zone} %{DATA:to_zone} %{INT:session_id} .*" ]
 }
}

if "FLOWDENY" in [tags] {
 grok {
 match => [ "message", ".*session denied %{IP:src_addr}/%{DATA:src_port}->%{IP:dst_addr}/%{DATA:dst_port} %{DATA:service} %{INT:protocol_id}\(\d\) %{DATA:policy_name} %{DATA:from_zone} %{DATA:to_zone} .*" ]
 }
}

}
}

output {

#stdout { codec => rubydebug }

if [type] == "syslog" {
 elasticsearch {
 hosts => ["escl01.nebuchadnezzar.local:9200"]
 index => "srx-%{+YYYY.MM.dd}"}
 }
}
The configuration above is from one of the Logstash nodes. Both are identical, but are connected to two different Elastic Search nodes. You can load-balance logstash towards ElasticSearch for added redundancy if desired.
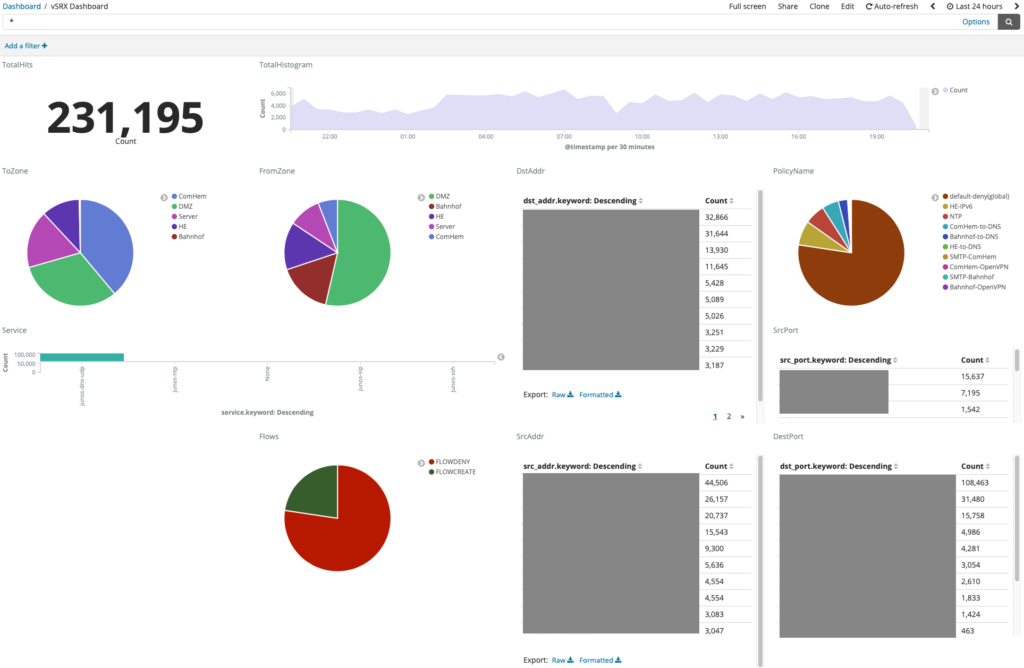
Kibana
After you managed to ingest data in Kibana, do the nessisary index patterns you should be good to go. I’ve included example visualisations and a dashboard here for download.
Leave a comment if you have any questions below.
)